
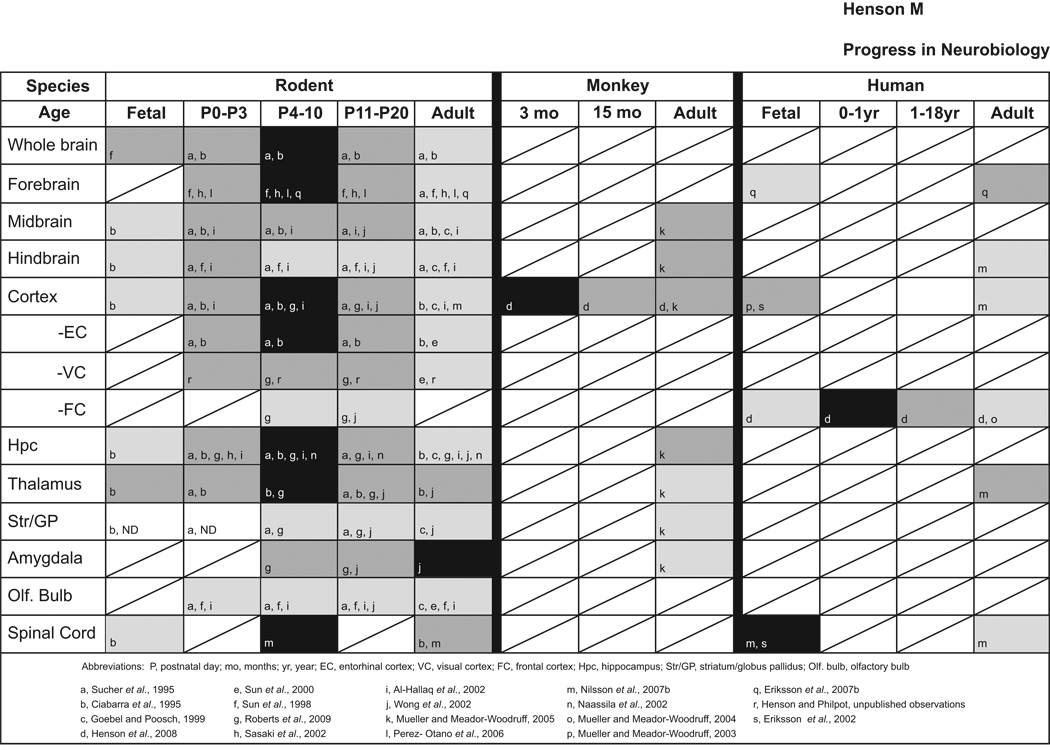
Table 1.
Developmental profile of NR3A expression patterns in rodent, monkey, and human brain. Consensus results of mRNA and protein expression data are depicted as having high (dark), moderate (gray), weak (light gray), and non-detectable (ND) levels of expression. Boxes with diagonal lines indicate no data available to date. Letters within boxes denote references as matched below. Most studies have been conducted in rodents and reveal a general pattern of low prenatal presence of NR3A that increases dramatically in the first two postnatal weeks, and declines into adulthood. When both isoforms were reported, only data from expression of NR3A-short sequences were considered. Note that this schematic is meant to present a general overview of NR3A expression, but the schematic is unable to depict data reported from specific subregions/cell layers (for these details, see cited manuscripts).
 |