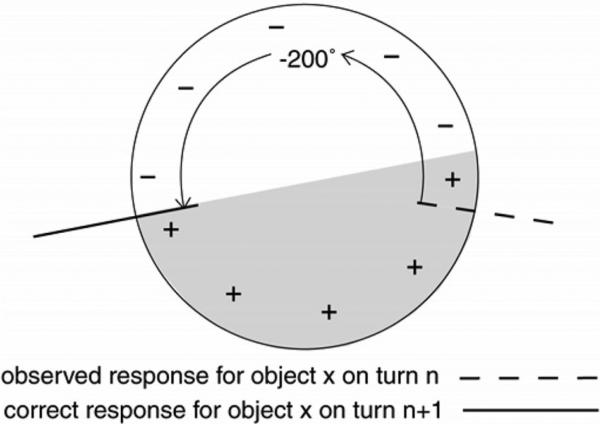
Figure 3.
Schematic illustration of how error scores were adjusted and linearized. This example assumes a turn size of 200°. Shaded region represents response range for which adjusted linear error scores associated with object x on turn n + 1 would be positive. Notice that the correct response for object x on turn n + 1 is adjusted for any error that may have been associated with the response for object x on turn n.

