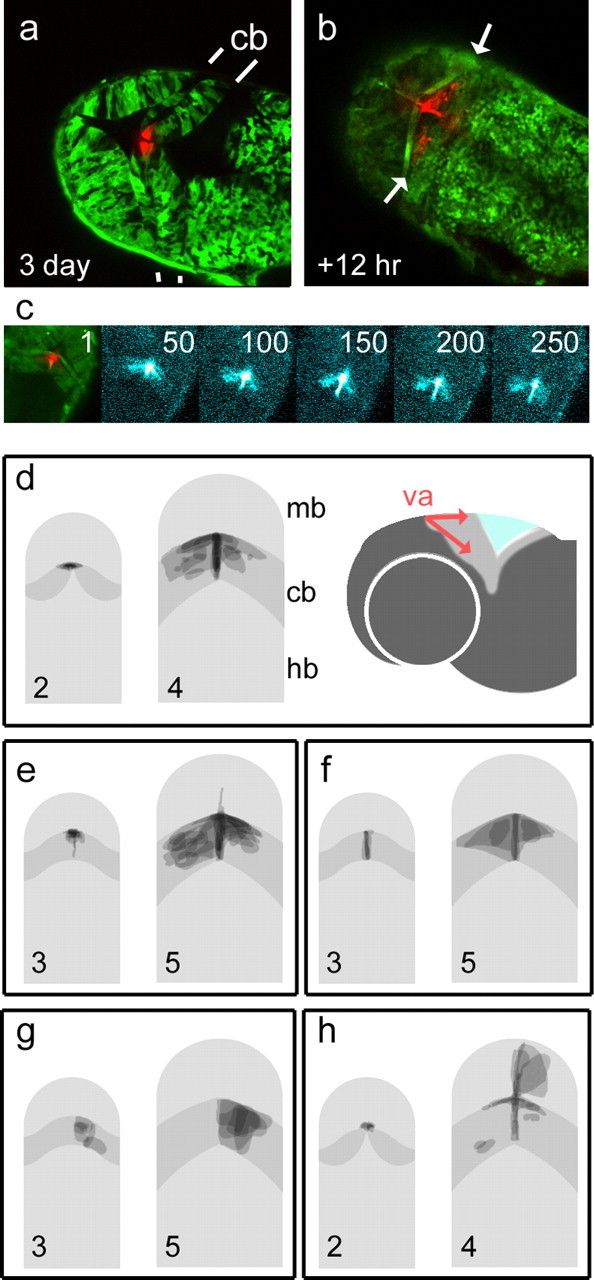
Figure 4.

Fate maps of midbrain and cerebellar precursor pools in zebrafish. Kaede RNA was injected into embryos at the one-cell stage to produce green fluorescent fish. Optical sectioning with a laser scanning confocal microscope reveals the cerebellum in dorsal view with clearly demarcated rostral and caudal boundaries (indicated by white lines). Photoconversion of cells at the presumptive valvulus (red) (va) of the cerebellum (cb) at 72 h (a) gives rise to symmetrically dispersed label 12 h later (arrows in b) within the unconverted, green-labeled cerebellum. Sequence (c) of confocal projections (11 optical sections) showing the spread of photoconverted cells over time. Frame numbers represent 5 min intervals. Frames 50–250 show photoconverted cells enhanced with a “thermal” color look-up table. Although the spatial domain occupied by the label spans the width of the cerebellum, the accompanying time-lapse sequence of 270 frames (supplemental movie, available at www.jneurosci.org as supplemental material) shows the continuous migration of midline derivatives replenishing the cerebellum. d–h show superimposed fate maps from a set of experiments in which cells were photoconverted at either 2 or 3 d and imaged after 48 h. Pairs of images show fate maps (right) grouped according to the location of labeled precursors (shown on left). The cerebellum is shown in dark gray. The valvulus of the cerebellum was labeled at 2 d (d) and 3 d, producing comparable, bilateral streams of cells as seen in a–c. To the right, a schematic lateral view shows direction of cell distribution from the valvulus (red). Bilateral derivatives were seen after photoconversion of the cerebellar midline (f) but not the corpus of the cerebellum (g). Photoconversion of the caudal midline of the midbrain adjacent to the valvulus at 2 d (h) labeled derivatives in both the cerebellar and midbrain midline, as well as cells within the optic tectum. Rostral is to the top in all panels. Hb, Hindbrain; mb, midbrain.
