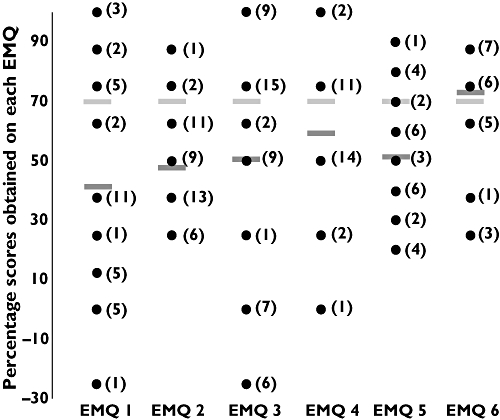
Figure 1.

The spread of percentage scores obtained by individual FY1 doctors on each EMQ and the relationship to the mean average percentage score and pass mark (70%). Confidence intervals are not shown in this figure. Key:  = Pass mark of assessment item
  = Mean average percentage mark obtained by FY1 on each assessment item EMQ 1 topic = Contra-indications in the use of anti-coagulates and antibiotics EMQ 2 topic = Anti-coagulants and analgesics in the post operative patient EMQ 3 topic = Diverticular disease; i.v. administration of antibiotics EMQ 4 topic = Respiratory; Chronic obstructive pulmonary disease EMQ 5 topic = Diabetes; insulin selection EMQ 6 topic = Analgesia in emergency medicine Numbers in brackets e.g. (1), indicate the number of individual FY1 doctors who obtained the particular score on each question Number of FY1 doctors completing the assessment item; EMQ 1 =35, EMQ 2 = 42, EMQ 3 = 49, EMQ 4 = 30, EMQ 5 = 28, EMQ 6 = 26. Maximum possible scores for each question are: EMQ 1 = 8, EMQ 2 = 8, EMQ 3 = 8, EMQ 4 = 8, EMQ 5 = 10, EMQ 6 = 8. Minimum possible scores for each question are: EMQ 1 =−8, EMQ 2 =−8, EMQ 3 =−8, EMQ 4 =−8, EMQ 5 =−10, EMQ 6 =−8. Range of scores on each question (min;max): EMQ 1 =−2 to 8, EMQ 2 = 2 to 7, EMQ 3 =−2 to 8, EMQ 4 = 0 to 8, EMQ 5 = 2 to 9, EMQ 6 = 2 to 7
