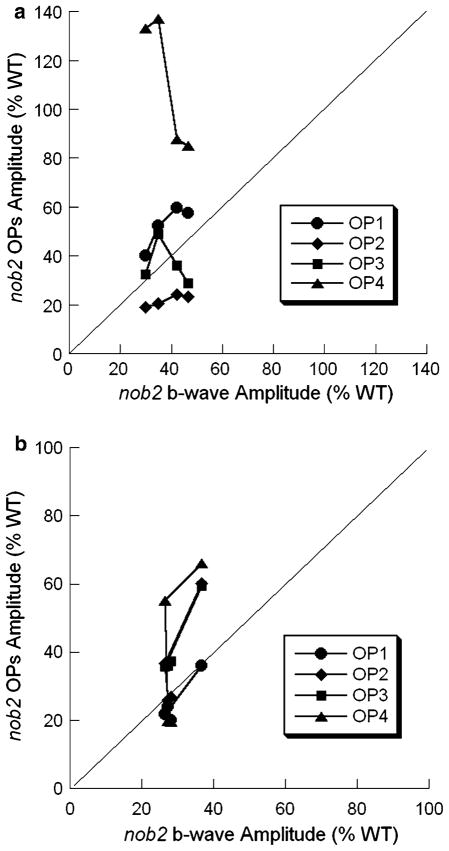
Fig. 15.
Comparison of the relative reductions b-wave and OP amplitudes of nob2 mice. Average nob2 data are expressed relative to the average WT response. Different symbols indicate the different OP wavelets. The diagonal line indicates an equivalent reduction of the ratio of amplitudes of b-wave and OPs between nob2 and WT mice in under different stimulus intensity. (a) Dark-adapted condition. (b) Light-adapted condition

