
Fig. 8.
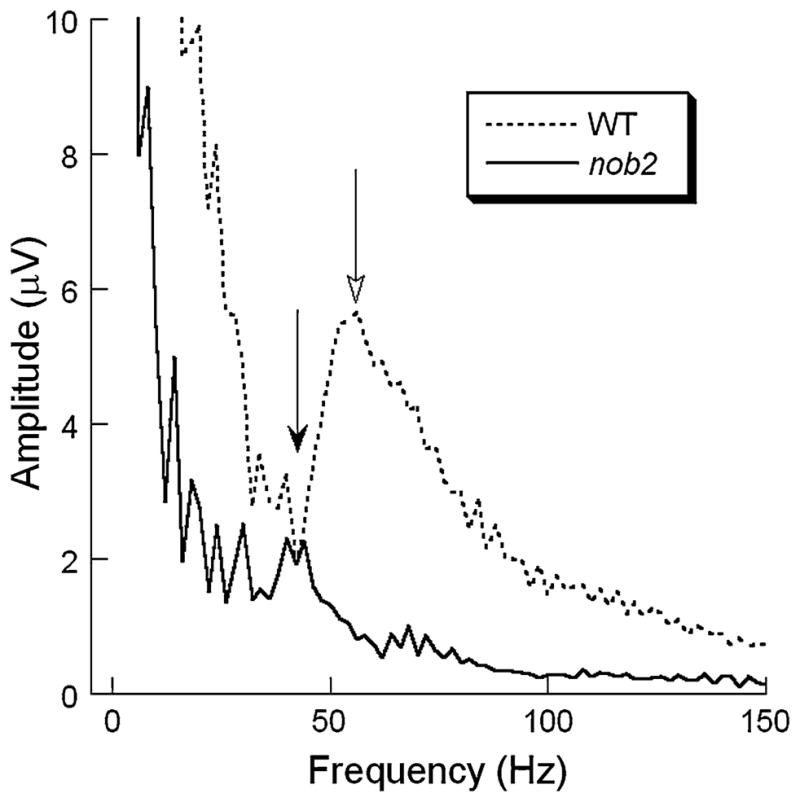
Average frequency spectra obtained to 1.9 log cd s/m2 stimuli superimposed on a rod-desensitizing adapting field for WT (dashed line) and nob2 (solid line) mice. Open arrow indicates the location of the dominant high frequency peak in WT mice. Filled arrow indicates the lower frequency peak in nob2 mice. Note that the amplitude axis truncates the low frequency region of these plots