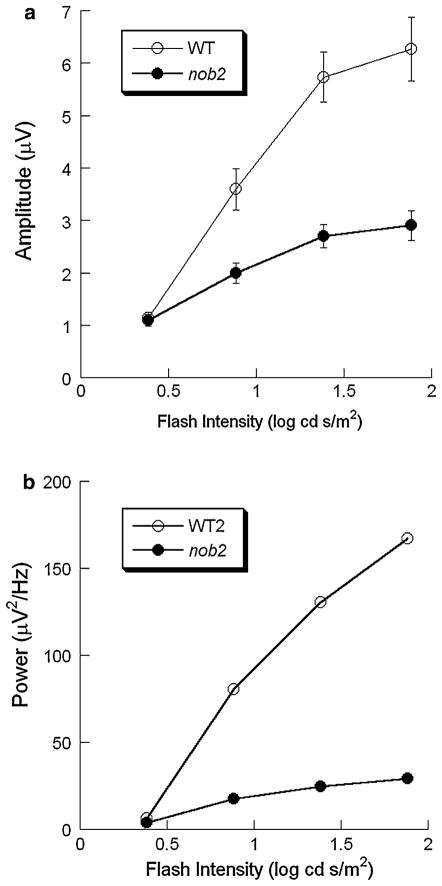
Fig. 9.
Intensity-response functions for the amplitude (a) or the integrated power (b) of the maximum high frequency component for WT (○) and nob2 (●) mice derived from light-adapted responses. Data points indicate the mean ± SEM. The integrated powers were calculated from the averaged frequency spectra

