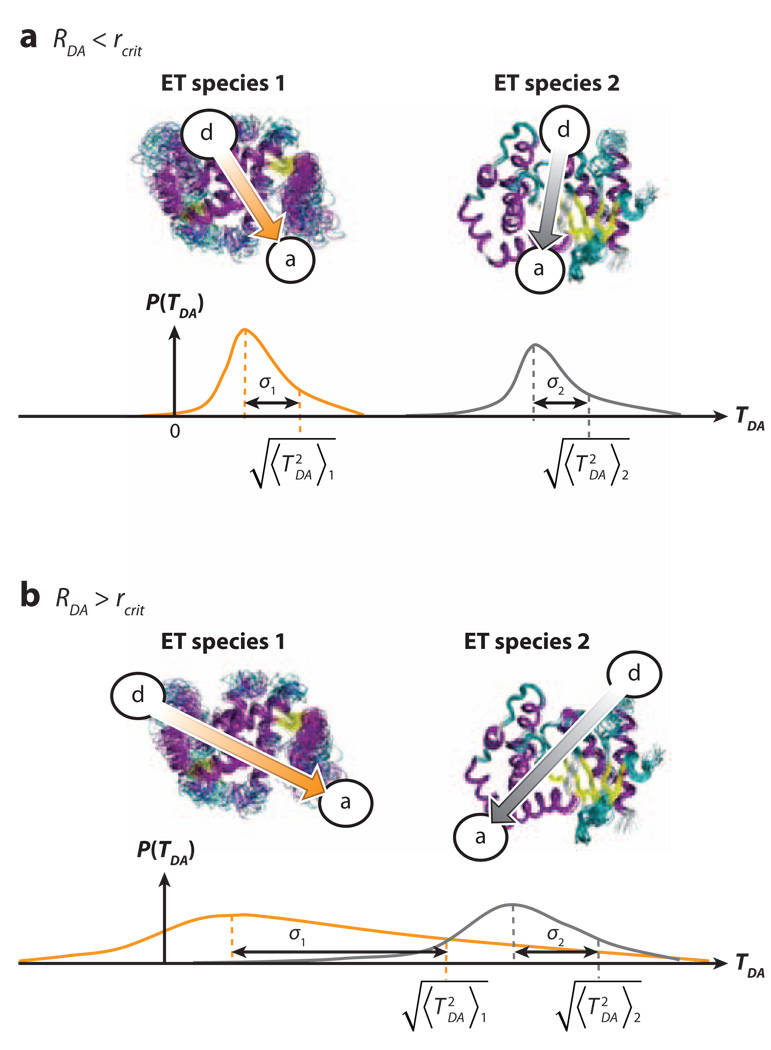
Figure 5.
Schematic diagram explaining how donor-acceptor (DA) coupling fluctuations could wash out DA coupling structural differences with increasing DA distance. The diagram shows possible TDA probability densities for two pairs of different electron-transfer (ET) species, each pair having the same average values of RDA. σ1 and σ2 represent the root-mean-squared coupling fluctuations σTDA of each species in the pair. (a) For RDA < rcrit, coupling fluctuations are small and do not wash out structural differences in , i.e., . (b) For RDA > rcrit, the increase in coupling fluctuations could wash out structural differences in , i.e., SRDA>rcrit ≪ 1, leading to an average barrier limit. Surprisingly, our simulations do not observe this second regime (b) even though coupling fluctuations are large (45).

