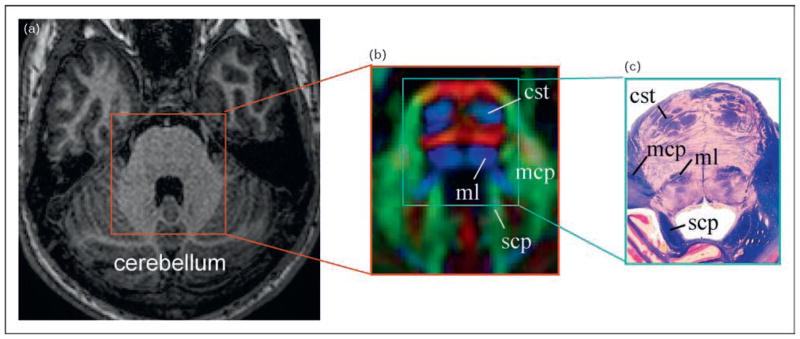
Figure 2. Comparison of T1-weighted image with a color-coded orientation map and histology.
Comparison of conventional T1-weighted (a), diffusion tensor imaging (DTI) based orientation map (b), and histology (c) of the pons. White matter structures are well resolved in DTI and match well to the histology sample, whereas the pons look quite homogeneous in the T1-weighted image. (b) The red, green, and blue colors represent fibers running along the right–left, anterior–posterior, and inferior–superior orientations. cst, corticospinal tract; mcp, medium cerebellar peduncle; ml, medial leminiscus; scp, superior cerebellar peduncle. Figure 2(c) was reproduced with permission from The Human Brain, John Nolte, Elsevier.

