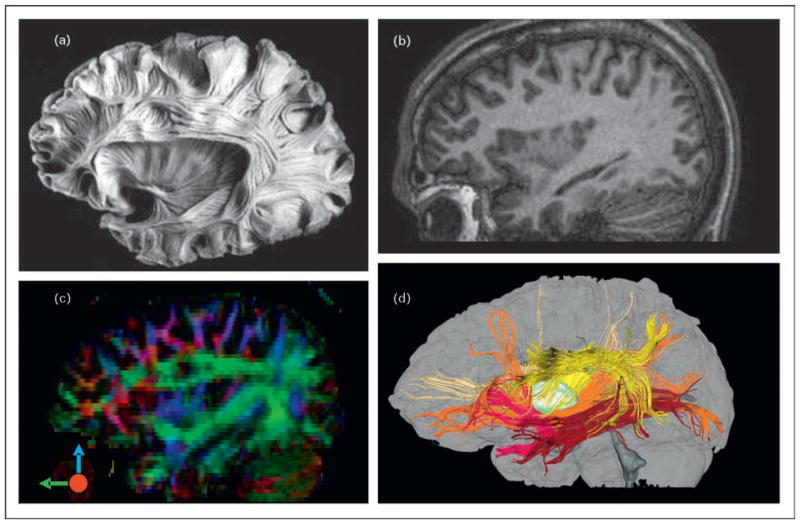
Figure 3. Comparison of a postmortem human brain specimen, T1-weighted image, color-coded orientation map, and three-dimensional tract reconstruction.
Comparison of a postmortem human brain specimen (a), T1-weighted image (b), color-coded orientation map (c), and three-dimensional tract reconstruction (d). MRI images (b–d) are from the same participant. In the color map (c), the red, green, and blue represent fibers running along the right–left (perpendicular to the plane), anterior–posterior, and superior–inferior axes. In the three-dimensional reconstruction results (d), the yellow, brown, orange, and red fibers represent the superior and inferior longitudinal fasciculus, the inferior fronto-occipital fasciculus, and the uncinate fasciculus, respectively. Figure 3(a) was reproduced with permission from Atlas Cerebri Humani, Ludwig E, et al. S. Karger AG, Basel.

