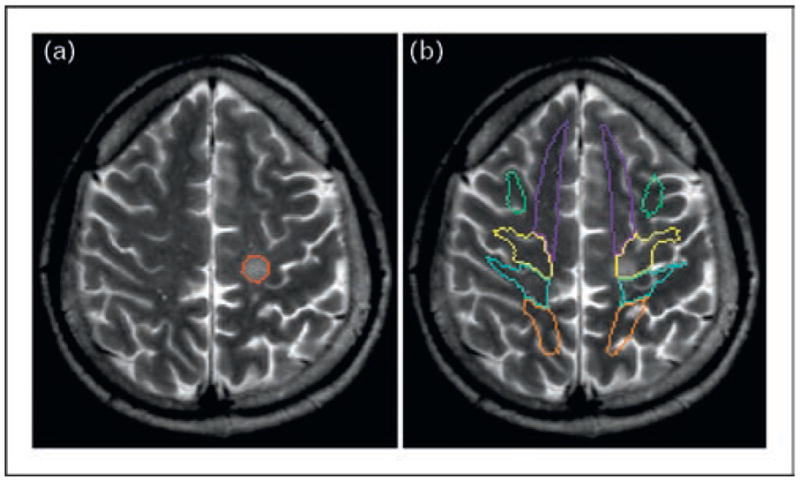
Figure 6. An example of atlas application.

The image is from a multiple sclerosis patient with a lesion in the white matter, as indicated by the red line (a). After shape normalization, the segmentation atlas of the white matter is superimposed (b). This provides a systematic way to identify affected white matter structures.
