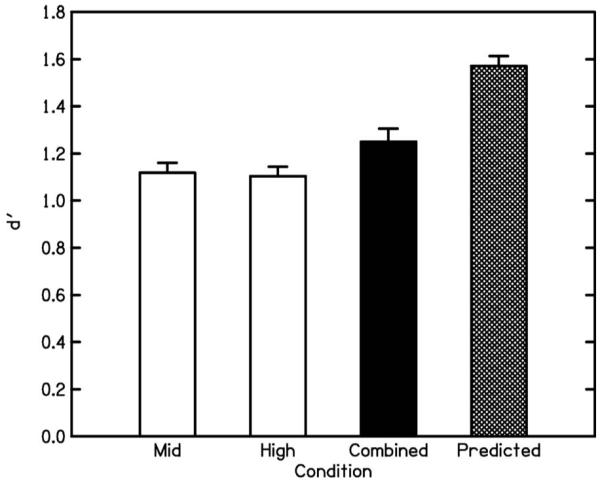
FIG. 1.

Means and SEs of obtained d′ values for experiment I, plus prediction, for F0-discrimination task. Stimuli were 400-ms complex tones filtered either into a mid spectral region (tone A) or a high spectral region (tone B) (white bars) or tones A and B combined (black bar). The prediction for the combined condition, assuming optimal combination of F0 information across the two frequency regions, is shown by the hatched bar. See text for details.
