
FIG. 2.
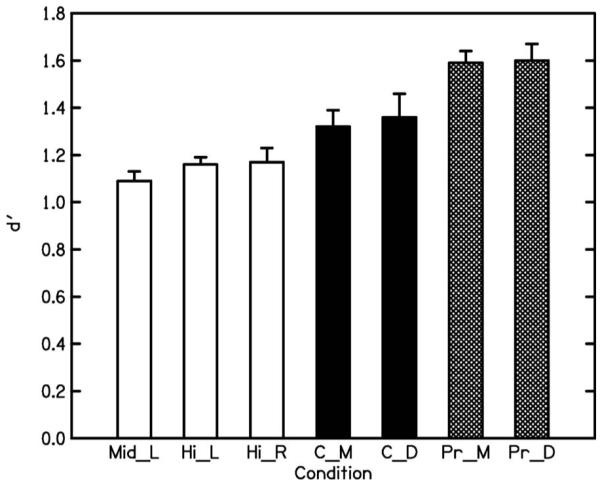
Results and predictions for F0-discrimination task (experiment II). The mean obtained d′ values and the corresponding SEs across subjects are shown by the five bars to the left and the predictions are shown by the two hatched bars to the right. The three white bars show performance in the conditions where each tone was presented individually: outer left—tone A, filtered into the mid region and presented to the left ear (Mid_L); second from the left—tone B, filtered into the high region and presented to the left ear (Hi_L); third from the left—tone B, filtered into the high region and presented to the right ear (Hi_R). The two black bars show performance in the conditions where the tones were combined: left—combined, monaural presentation (C_M); right—combined, dichotic presentation (C_D). The two hatched bars on the right-hand side show the predictions derived for the monaural combined condition (Pr_M) and for the dichotic combined condition (Pr_D), assuming optimal combination of information across frequency regions and independent noises. See text for details.