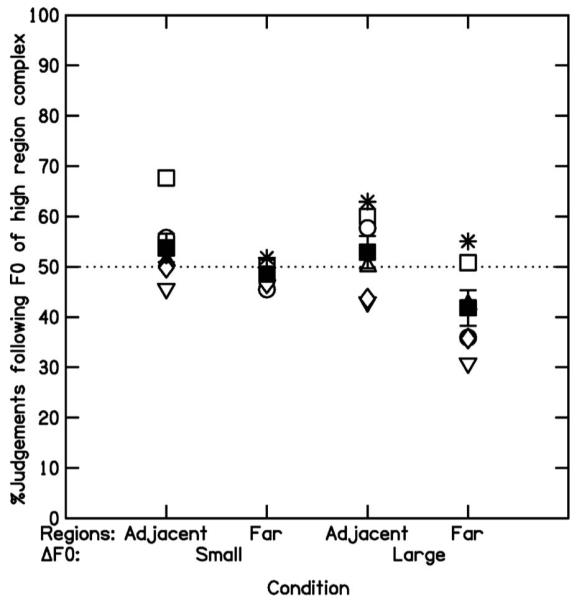
FIG. 3.

Results for experiment III, showing the percentage of trials in which subjects judged the stretched signal (F0 of complex in high region increased; F0 of complex in mid region decreased) to be higher in pitch than the compressed signal (F0 of complex in high region decreased; F0 of complex in mid region increased). Empty symbols show the scores for six subjects. The solid squares (and error bars) show the mean score (and SEs) across subjects. See text for details.
