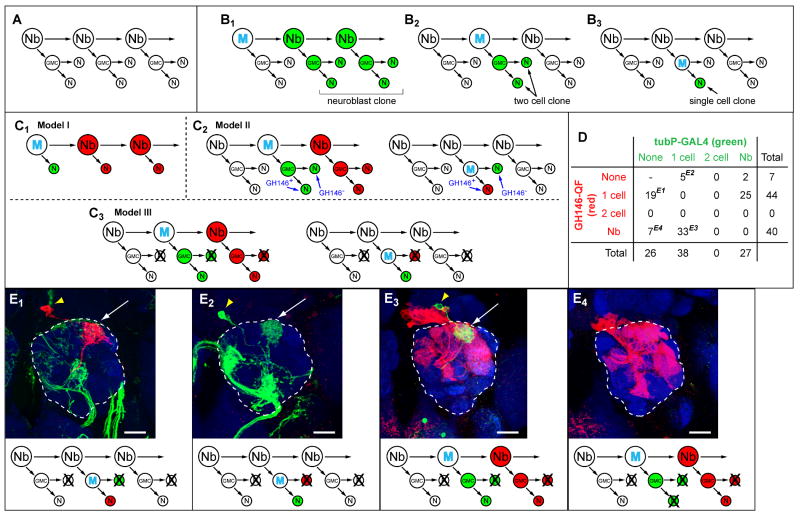
Figure 4. Lineage Analysis Using Coupled MARCM.
(A) General scheme for neuroblast division in the insect CNS. Nb, neuroblast; GMC, ganglion mother cell; N, postmitotic neuron.
(B) Three types of MARCM clones predicted from the general scheme. M, mitotic recombination.
(C) Three models to account for the lack of two cell clones in GH146-labeled MARCM. (C1) Each neuroblast division directly produces a postmitotic GH146-positive PN without a GMC intermediate. (C2) Each GMC division produces a GH146-positive PN and a GH146-negative cell. (C3) Each GMC division produces a GH146-positive PN and a sibling cell that dies. For models II and III, simulations of coupled MARCM results are shown for mitotic recombination that occurs either in the neuroblast or in the GMC.
(D) Tabulation of coupled MARCM results. Superscripts next to the numbers correspond to the images shown in (E) as examples.
(E) Examples of coupled MARCM that contradict models I and II, but can be accounted for by model III (bottom). (E1-E2) A single QF- (E1) or GAL4- (E2) labeled PN in the absence of labeled siblings. These events contradict model I (C1). In both examples, the additional green staining in the antennal lobe belongs to tubP-GAL4 labeled axons from olfactory receptor neurons. (E3) A single tubP-GAL4 labeled sibling (green) of a GH146-QF labeled neuroblast clone (red). This observation contradicts model II (C2). (E4) An occasional QF-labeled neuroblast clone with no tubP-GAL4 labeled siblings. All images are z-projections of confocal stacks; green, anti-CD8 staining for UAS-mCD8-GFP; red, anti-HA staining for QUAS-mtdT-HA; blue, neuropil markers. Arrowheads, PN cell bodies; arrows, dendritic innervation in the antennal lobe (outlined).
Scale bars: 20 μm.
See Figure S4 for a schematic for these coupled MARCM experiments.

