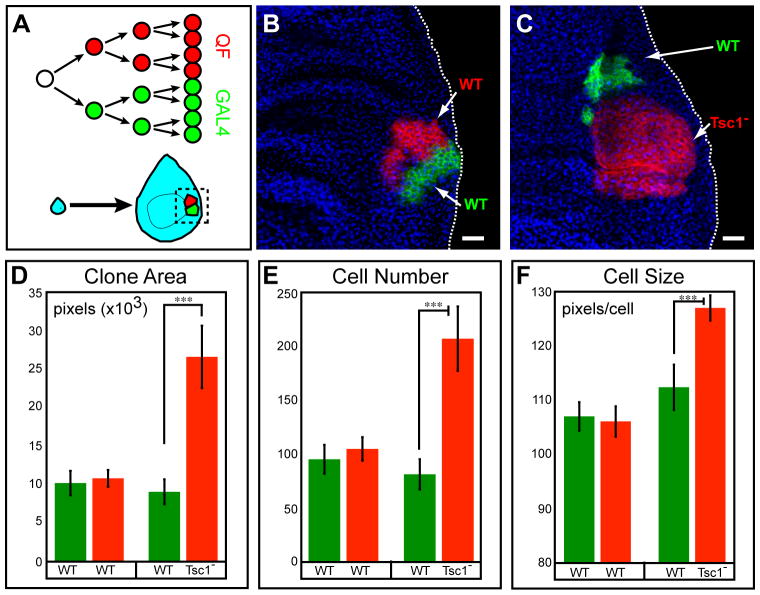
Figure 5. Coupled MARCM for Clonal Analysis of Mutant Phenotypes.
(A) Schematic for coupled MARCM labeling of dividing cells during imaginal disc development.
(B) A control coupled MARCM clone. Both GAL4- and QF-labeled siblings are wild type. Genotype: hsFLP, QUAS-mtdT-HA, UAS-mCD8-GFP (X); ET40-QF, QUAS-mtdT-HA/+ (II); tubP-GAL4, 82BFRT, tubP-GAL80/82BFRT,tubP-QS (III).
(C) A coupled MARCM clone where GAL4-labeled sibling (green) is wild type, while QF-labeled sibling (red) is homozygous mutant for Tsc1. Genotype: hsFLP, QUAS-mtdT-HA, UAS-mCD8-GFP (X); ET40-QF, QUAS-mtdT-HA/+ (II); tubP-GAL4, 82BFRT, tubP-GAL80, Tsc1Q600×/82BFRT, tubP-QS (III).
Green, anti-CD8; Red, anti-HA; Blue, anti-fibrillarin (labels nucleoli). Scale bars: 20 μm.
(D-F) Quantification of clone area, cell number and cell size for experiments in B and C. n=30 for WT vs. WT; n=21 for WT vs. Tsc1. Error bars are ± SEM. ***, p<0.001.
Figure S5 shows additional characterization of the effects of QF, GAL4, or QF+GAL4 expression on imaginal disc differentation.

