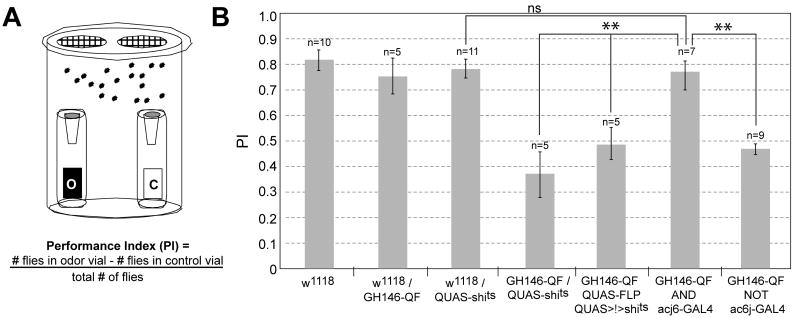
Figure 7. Defining PNs Responsible for Olfactory Attraction Using Intersectional Methods.
(A) Schematic of the olfactory trap assay. O,1% ethyl acetate in mineral oil; C, control (mineral oil alone). A performance index (PI) is used to measure olfactory attraction.
(B) Performance index plots of flies of listed genotypes. Error bars are ± SEM. **, p≤0.01. ns, not significant.
Genotypes: (GH146-QF AND acj6-GAL4) acj6-GAL4, GH146-QF, UAS-FLP, QUAS>stop>shibirets1; (GH146-QF NOT acj6-GAL4) acj6-GAL4, GH146-QF, UAS-QS, QUAS-shibirets1. “>”, FRT site; “>!>”, transcriptional stop>.

