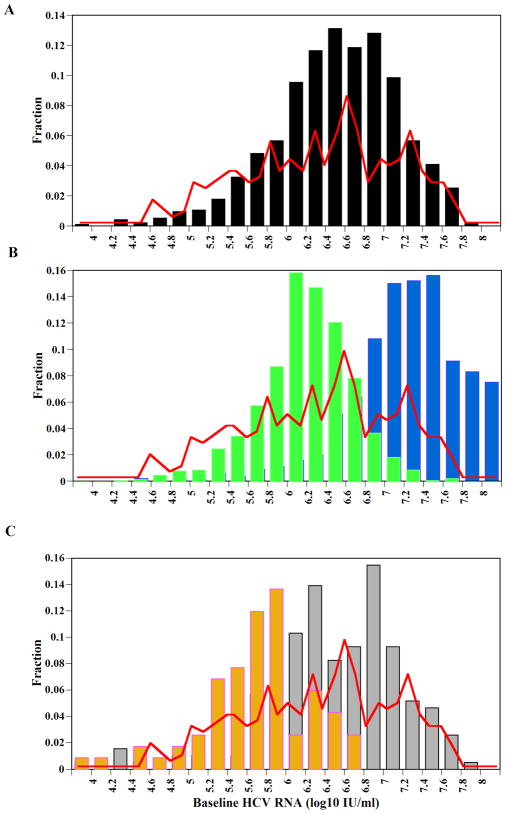
Figure 1. The distribution of baseline HCV-RNA levels.
(A) The predicted baseline viral load distribution from one thousand simulated patients with a range of p=0.1–6 virions/day and β=1×10⁻⁹–1×10⁻⁸ ml/day/virions (black bars) is close to the observed baseline HCV-RNA distribution in the U. S. (red line), digitized from Nainan et al.27. (B) With a larger range of p=0.1–45 virions/day and the same β=1×10⁻⁹–1×10⁻⁸ ml/day/virions the predicted HCV-RNA distribution (blue bars) is skewed right from the actual distribution (red line), and with a range of p=0.1–6 virions/day and a higher infectivity rate constant, β=1×10⁻⁷–1×10⁻⁶ ml/day/virions (green bars) it is skewed to the left due to increased rates of infected cell death, δ, and HCV clearance, c (Table 3). All other model parameters (Table 1) did not significantly change the distribution of HCV-RNA values in (A) and (B) (not shown). (C) Distribution of baseline HCV-RNA in cirrhotic (brown bars) and non-cirrhotic (gray bars) patients, from the University of Illinois at Chicago.

