Figure 2.
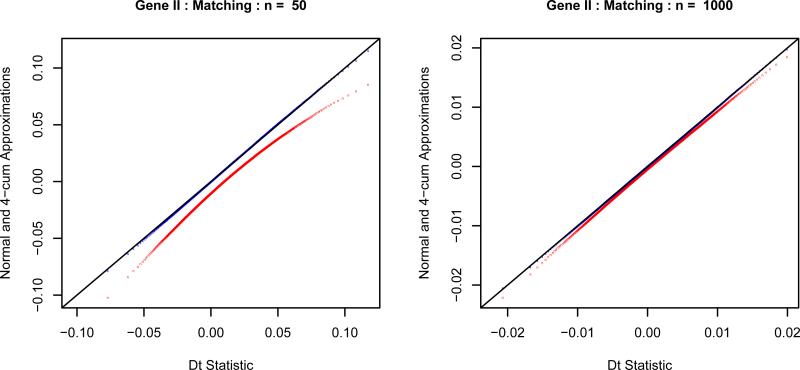
The qq-plots of the 4-cum chi-square approximation (blue “4”) and the normal approximation (red “n”) to the distribution of Dt under the null hypothesis using Gene II and the matching measure. We use the true values of p and q here. The left plot has a smaller sample size n = 50 and m = 150. The right plot has a larger sample size n = 1000 and m = 3000.

