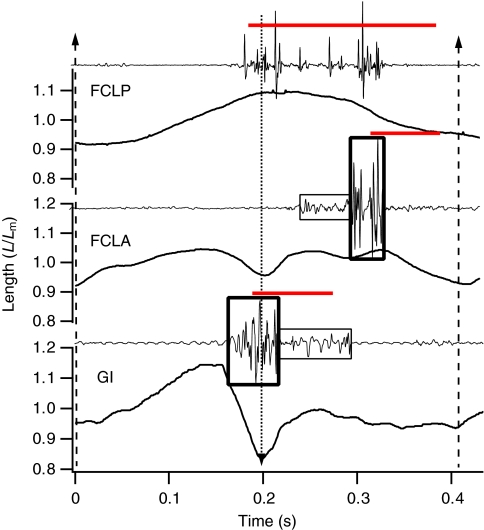
Fig. 4.
Representative muscle segment length and electromyogram (EMG) traces from the guinea fowl flexor cruris lateralis pars pelvica (FCLP), flexor cruris lateralis pars accessoria (FCLA) and gastrocnemius intermedia (GI) during treadmill running at 1.5 m s–1. The timings of foot-down and toe-off are indicated by vertical dotted and dashed arrows, respectively. Segment length, L, is expressed relative to mean segment length, Lm. High- and low-amplitude FCLP and GI EMG segments are bounded by thick and thin bordered boxes, respectively. Red horizontal lines indicate the estimated timing of muscle force production associated with high-amplitude EMG activity. The period of force production was calculated assuming activation and relaxation electromechanical delays of 25 and 60 ms, respectively.

