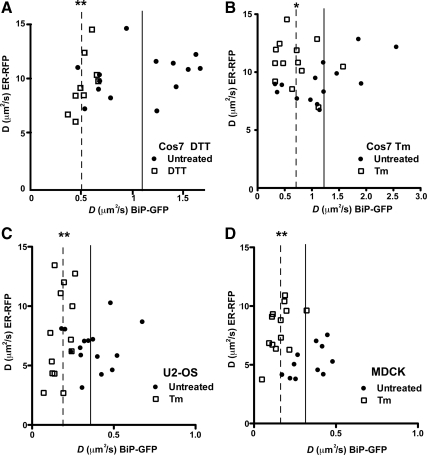
Figure 5.
Comparison of BiP-GFP and ER-RFP mobility in homeostatic and stressed single cells. Plot of D values for both ER-RFP and BiP-GFP in transiently transfected Cos7 (A and B) or U2-OS (C) or MDCK (D) cells expressing both proteins. Cells were either untreated (●) or treated with 10 mM DTT for 1 h or 5 μg/ml Tm for 4 h (□). Boxes have been drawn to highlight differences in distributions. Solid and dashed lines indicate mean BiP-GFP D values for untreated and treated cells, respectively. Means are statistically significant to * p ≤ 0.05 and ** p ≤ 0.01, according to Student's t test analyses.

