Figure 2.
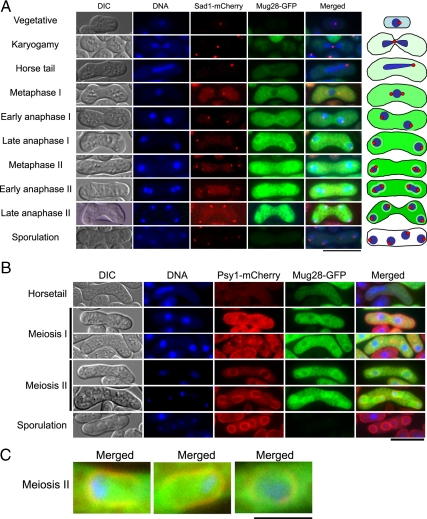
Subcellular localization of Mug28-GFP in living S. pombe cells. (A) Fluorescence signals from Mug28-GFP and Sad1-mCherry were observed at multiple stages of meiosis after meiotic induction by nitrogen starvation in AS127 (h90 mug28+-GFP sad1+-mCherry) cells. Differential interference contrast (DIC) images are shown in the leftmost panels. Fluorescence microscopy images showing DNA (blue), Sad1-mCherry (red), Mug28-GFP (green), and the corresponding merged images are shown. The schematically depicted images are shown in the rightmost panel. Bar, 10 μm. (B) Fluorescence signals from Mug28-GFP and Psy1-mCherry were observed at multiple stages of meiosis after meiotic induction by nitrogen starvation in AS181 (h90 mug28+-GFP psy1+-mCherry) cells. DIC images are shown in the leftmost panels. Fluorescence microscopy images showing DNA (blue), Psy1-mCherry (red), Mug28-GFP (green), and the corresponding merged images are shown. The schematically depicted images are shown in the rightmost panel. Bar, 10 μm. (C) Enlarged images of Mug28-GFP colocalized with Psy1-mCherry during meiosis II. Bar, 2.5 μm.

