Figure 5.
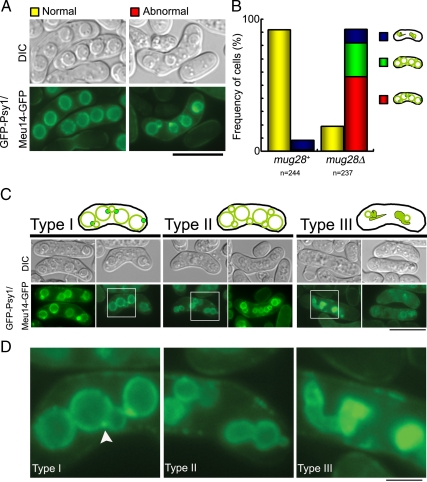
Simultaneous observation of Meu14-GFP and GFP-Psy1 signals in mug28+ and mug28Δ cells at sporulation. (A) Typical images of normal and abnormal mug28+ and mug28Δ cells expressing Meu14-GFP/GFP-Psy1 at sporulation. SOP091w (meu14+-GFP GFP-psy1+) and AS161 (meu14+-GFP GFP-psy1+ mug28Δ) cells were induced to enter meiosis by nitrogen starvation, and GFP signals (green) and differential interference contrast (DIC) images were acquired. Bar, 10 μm. (B) Histogram of the normal and abnormal Meu14-GFP/GFP-Psy1 expressing cells in mug28+ and mug28Δ strains. Red, green, and blue areas indicate type I, II, and III categories of abnormal Psy1/Meu14 localization, respectively. (C) Typical fluorescence images of abnormal Meu14-GFP/GFP-Psy1 expressing cells. (type I) mug28Δ cells that display a strong signal of residual Meu14-GFP at the junction between mother and daughter FSMs are classified as type I. (type II) mug28Δ cells that display more than four snowman-like FSMs without Meu14-GFP dots are classified as type II. (type III) mug28Δ cells that display extraordinarily deformed Meu14-GFP signals are classified as type III. Bar, 10 μm. (D) Enlarged views of the regions enclosed by white squares in C. White arrowheads indicate the abnormal behavior of Meu14-GFP at the bud-neck between mother and daughter FSMs. Bar, 10 μm.

