Figure 7.
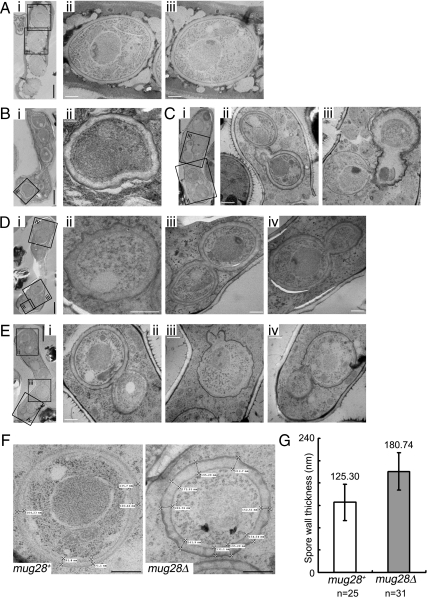
Thin-section EM of mug28+ (AS6) and mug28Δ (AS99) cells at sporulation. (A) i, typical EM image of the mug28+ strain. ii and iii, enlarged views of the indicated regions, showing normal spores. (B) i, typical electron microscopy image of mug28Δ cell. ii, enlarged view of the indicated region shows an abnormal spore with a thick spore wall. (C) i, typical EM image of a mug28Δ cell. ii and iii, enlarged views of the indicated regions showing abnormally shaped snowman-like spores. (D) i, typical EM image of a mug28Δ cell carrying six spores. ii–iv, enlarged views of the indicated regions showing abnormally shaped snowman-like spores. (E) i, typical EM image of a mug28Δ cell. ii–iv, enlarged views of the indicated regions show abnormally shaped snowman-like spores. White bar, 0.5 μm. Black bar, 2 μm. (F) Wall thickness of mug28+ and mug28Δ spores. Bar, 0.5 μm. (G) Histogram of the average spore wall thickness of mug28+ and mug28Δ cells. Spore wall thickness was measured at 25 and 31 positions for mug28+ and mug28Δ spores, respectively. The errors bars show the SD.

