Figure 8.
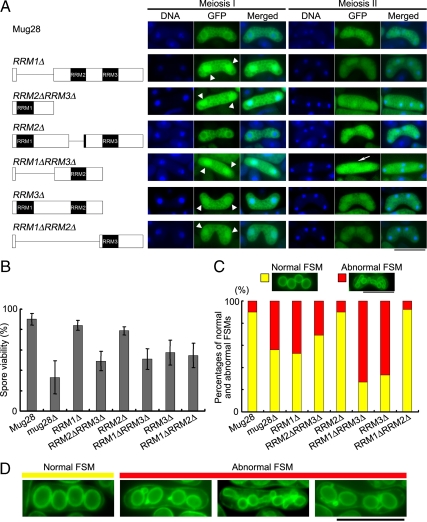
Functional analysis of the RRM deletion mutants of Mug28. (A) Schematic representations of the truncated forms of Mug28 that are expressed as C-terminal GFP fusion proteins are shown in the left panels. Fluorescence images of the Mug28-GFP deletion mutants (green) and of DNA (blue), and merged images, observed at meiosis I and meiosis II, are shown in the middle and right panels, respectively. Arrowheads in the middle panel indicate the abnormal localization of Mug28-GFP in the nucleus during meiosis I. An arrow in the right panel indicates the aberrant uniform localization of Mug28-RRM1ΔRRM3Δ-GFP in the cytoplasm during meiosis II. Bar, 10 μm. (B) Bar graphs of the spore viability of the deletion mutants, as measured by random spore analysis. Bar graphs show the averages of three independent experiments with SEs. At least 200 spores were measured for each strain. (C) Histogram of normal and abnormal FSM formation in the indicated deletion mutants (bottom) and their typical corresponding phenotypes (top). Bar, 10 μm. (D) Typical images of normal and abnormal FSM formation in the deletion mutants of Mug28, in which the YFP-Psy1 signals (green) were observed by fluorescence microscopy. Bar, 10 μm.

