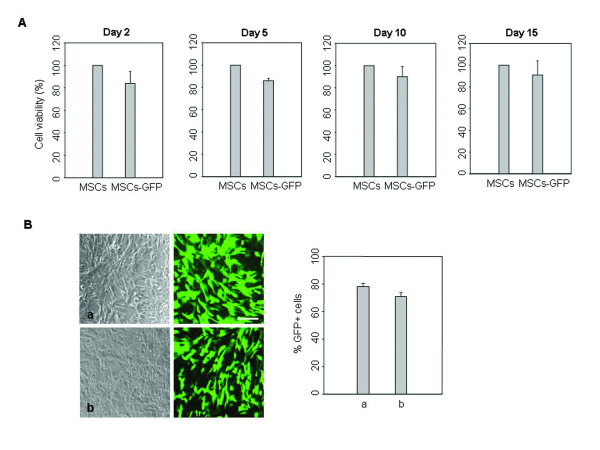
Figure 2.
Transfection efficiency of hUCB-MSCs from different donors. (A) After microporation, cells survival was analyzed by the MTS assay at different time points under standard culture conditions (a-MEM containing 10% FBS and subculturing at 90% confluency). (B) pEGFP-N1 vector was transfected into different hUCB-MSCs from different donors by microporation. After 24 hr, the expression of EGFP was analyzed using phase contrast and fluorescence microscopy. Transient expression of EGFP was assessed by FACS analysis. The data are expressed as the mean ± SEM; n = 3. Scale bar = 200 μm.

