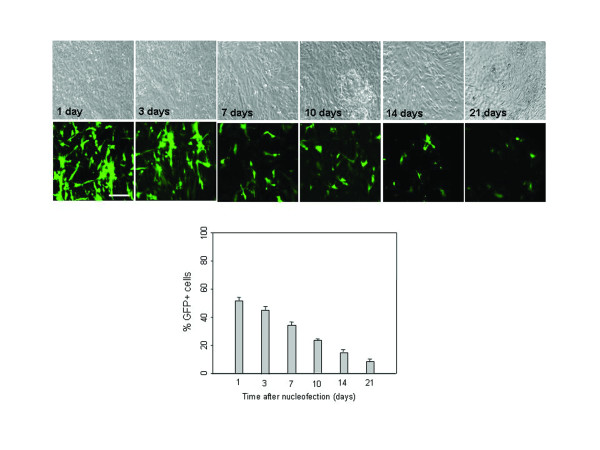
Figure 4.
Time-course analysis of EGFP expression in nucleofected hUCB-MSCs. pEGFP-N1 (2 μg) was transfected into hUCB-MSCs by nucleofection. The expression of EGFP was analyzed using phase contrast and fluorescence microscopy at different time points after transfection. Persistence of EGFP expression in hUCB-MSCs was analyzed by FACS analysis under conditions of restrained cell division (a-MEM containing 2% FBS and no passaging). EGFP expression was assessed at different time points after transfection. The data are expressed as the mean ± SEM; n = 3. Scale bar = 200 μm.

