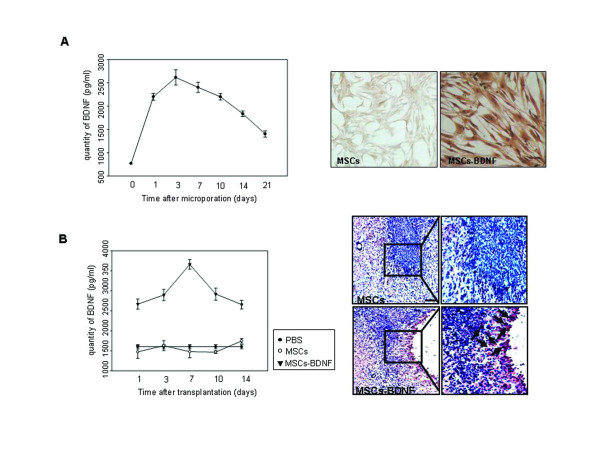
Figure 7.
Time-course analysis of BDNF expressions in microporated hUCB-MSCs. (A, left panel) pEGFP-BDNF (2 μg) was transfected into hUCB-MSCs by microporation. The concentration of secreted BDNF was determined using an ELISA assay under conditions of expanded cells (a-MEM containing 10% FBS). (A, right panel) Cells were stained for BDNF 3 days after transfection. (B, left panel) For the quantification of BDNF levels and longevity of BDNF expression in vivo, brain tissues were homogenized at 1, 3, 7, 10, and 14 days (n = 3/each group) after treatment and then assessed by ELISA. (B, right panel) Tissues were stained for BDNF 3 days after transplantation. Nuclei were counterstained with Hematoxylin (blue). The data are expressed as the mean ± SEM; n = 3. Scale bar = 200 μm.

