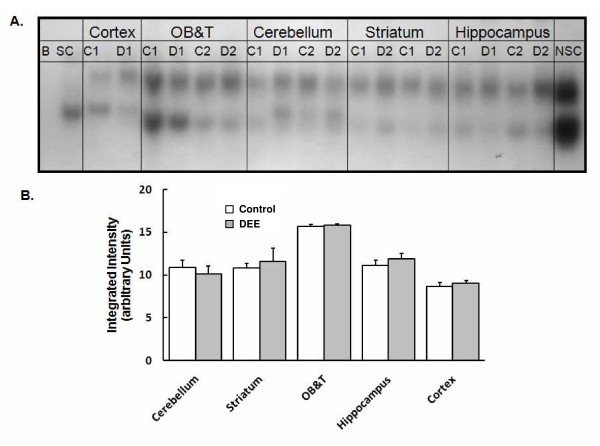
Figure 2.
NF-κB activation after DEE exposure. A. A gel demonstrating NF-κB shifted bands. Samples from different brain regions were assayed on the same gel. Based on the competitor reactions, the top band is specific for NF-κB. B = Blank; SC = Specific competitor; NSC = Non-specific competitor; C = nuclear fraction derived from the brain of animals exposed to filtered air; D = nuclear fractions derived from the brain of animals exposed to DEE; the results for two separate animals (designated as 1 or 2) are shown on this gel. B. The sum intensity of NF-κB specific shifted band (first band shown above) in different regions of the rat brain after exposure to purified air (Control) or DEE (Diesel). Each brain region was analyzed on different days on separate gels and therefore this figure does not allow direct comparison between various brain regions. Bars represent mean of 5 individual animals ± SE.

