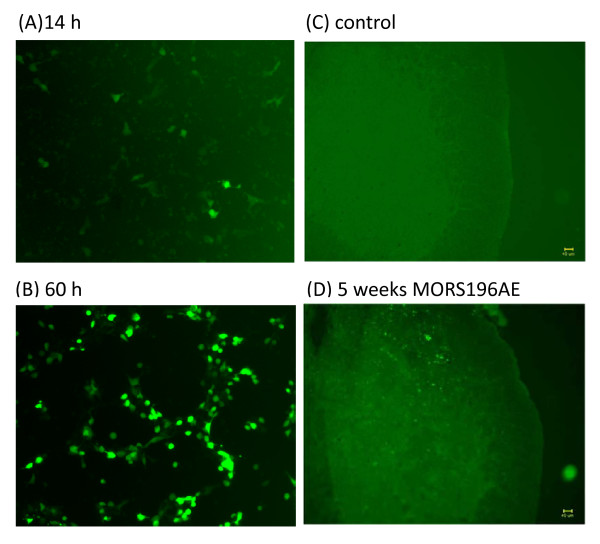
Figure 2.
Fluorescence micrographs in vitro and in vivo. (A)-(B) Representative fluorescence micrographs of HEK-293 cells 14-60 h after they had been transfected with the dsAAV2-MORS196A-EGFP gene (magnification: 100×). (C) A representative spinal cord slice from a control mouse not transfected. (D) A representative spinal cord slice from MOR-KO mice four weeks after transfection (magnification: 100×). Scale bars = 40 μm.

