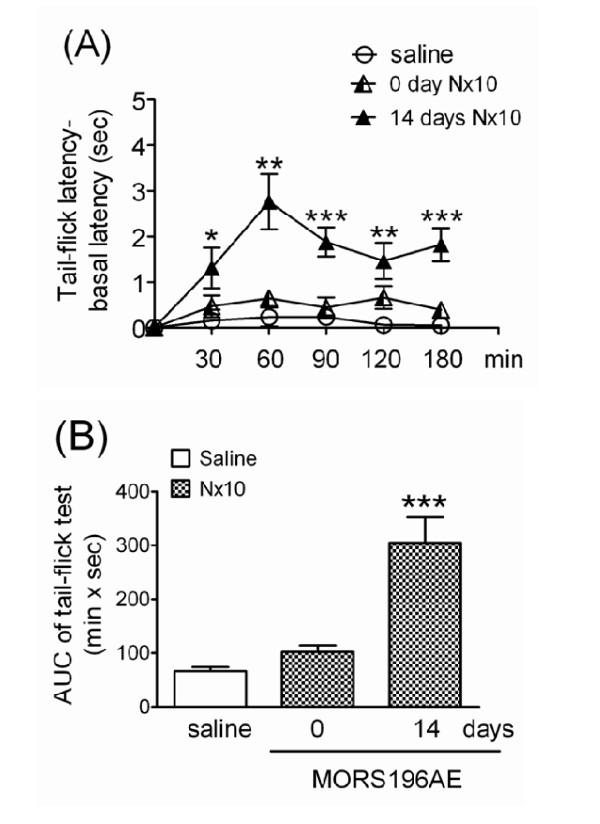
Figure 5.
Antinociceptive effect of naloxone in MOR-KO mice determined using tail-flick tests before and after they had been transfected with the dsAAV2-MORS196A-EGFP gene. (A) The time-response curves for saline and 10 mg/kg naloxone before (0 day Nx10) and 14 days (14 days Nx10) after transfection. *P < 0.05, **P < 0.01, ***P < 0.001 (vs. saline). (B) The mean AUC (area under curve) values for each treatment in Fig. 5A (n = 12). ***P < 0.001 (vs. saline).

