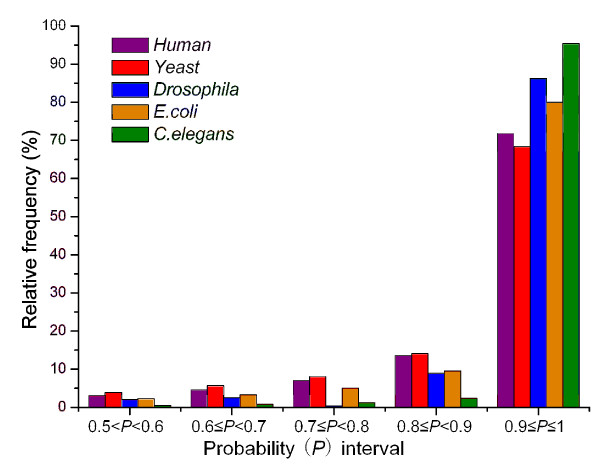
Figure 2.
The frequency distributions of the correctly predicted samples within different probability intervals. Among the correctly predicted samples under the default probability threshold of 0.5, the relative frequency distributions of them within different probability intervals are represented by this figure.

