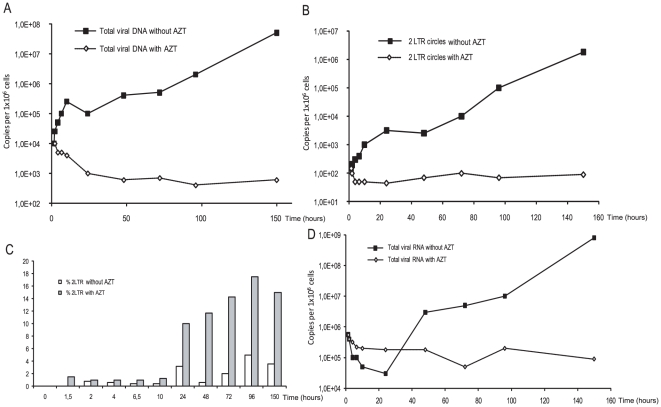
Figure 3. Kinetic analysis of PFV RNA and DNA synthesis over 6 days post-infection.
U373-MG cells were infected in the presence or absence of AZT. Viral DNA (A), 2-LTR circles (B), viral RNA (C) were monitored by real-time PCR and RT-PCR. The percentage of 2-LTR circles over linear viral DNA is represented (C).

