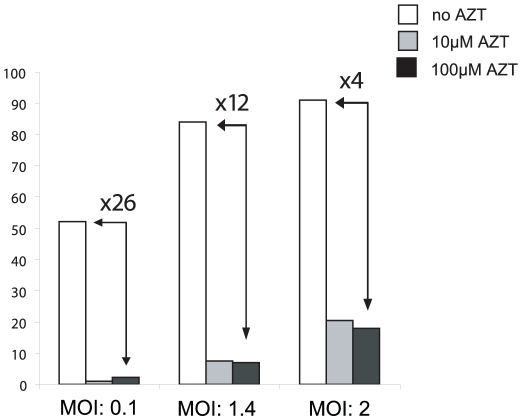
Figure 5. Effect of increasing MOI on infectivity under AZT treatment.
Indicator FAG cells were infected with increasing MOIs in the presence or absence of AZT at two different concentrations, 10 µM and 100 µM. Forty eight hpi, GFP expression was monitored by flow cytometry. The values represented the average of three independent experiments.

