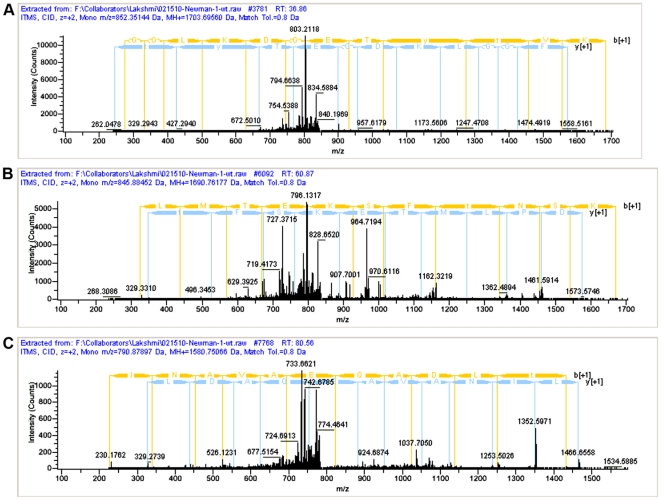
Figure 7. MS spectra of threonine phosphorylated peptides corresponding to SdrE (A), NWNM_1123 (B) and DNA binding protein HU (C).
The mass spectra show neutral loss of phosphoric acid from phosphopeptides that were unique to WT Newman (i.e. not detected in the Δstk1 mutant). (A) the m/z of the doubly charged precursor ion corresponding to SdrE is 852.35144. Note that the peak depicting neutral loss of phosphoric acid (H3PO4) has an m/z of 803.2118 due to the loss of 49 Da from the doubly charged peptide. (B) Likewise, the peak depicting neutral loss of phosphoric acid (H3PO4) from the precursor ion corresponding to NWNM_1123 has an m/z of 796.1317 due to the loss of 49 Da from the doubly charged peptide. (C) Note that the peak depicting neutral loss of phosphoric acid (H3PO4) has an m/z of 742.6785 due to the loss of 49 Da from the doubly charged peptide corresponding to DNA binding protein HU.

