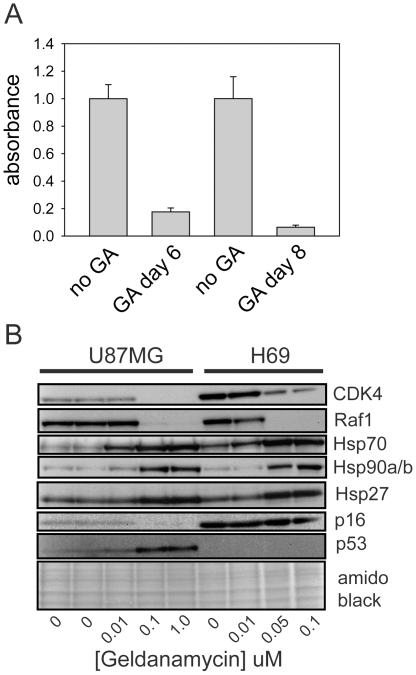
Figure 3. BrdU incorporation and client protein responses in Hsp90 inhibitor-treated cells.
A. H69 cells were treated for 48 h with 100 nM geldanamycin. Geldanamycin was then removed. Six or eight days after drug removal, 25,000 treated cells (GA) per well were plated in ninety-six well plates along with the same number of untreated H69 cells for comparison (no GA). Cells were allowed to uptake BrdU for 16 h and BrdU incorporation was then assayed as described in Materials and Methods. Results were normalized to the values for untreated cells. Data shown are the mean ± SD of six replicates. B. Cells were treated for 48 h with geldanamycin. Total cell lysates were then collected and analyzed by Western blotting using antibodies to the indicated proteins. The bottom panel shows a blot stained for total protein with amido black prior to antibody incubation. Equal amounts of DMSO were added to cells for each treatment, except in the leftmost lane, where DMSO was omitted.

