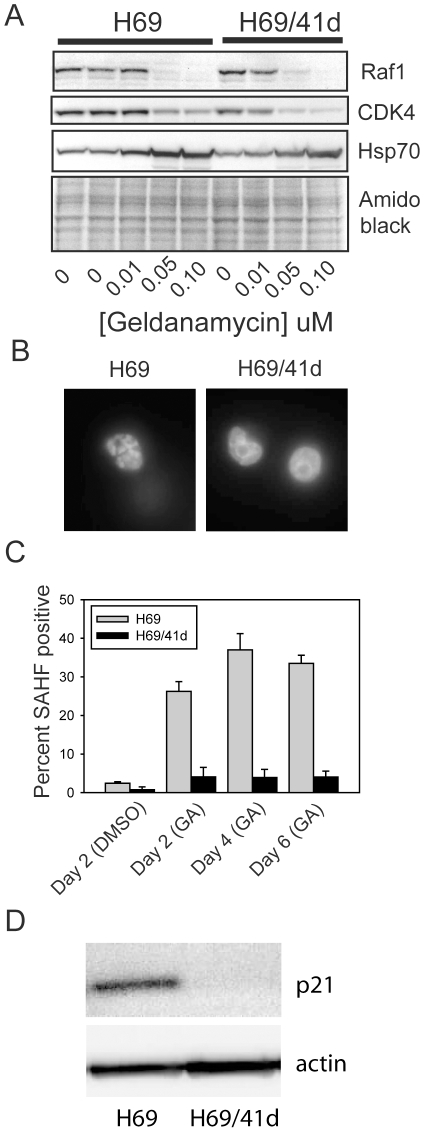
Figure 6. Client protein degradation and SAHF induction in H69/41d cells.
H69 and H69/41d cells were treated for 48 h with geldanamycin or DMSO as vehicle control. A. Total cell lysates were collected after 48 h treatment and analyzed by Western blotting as in Figure 3. B. DMSO-treated cells were stained for SAHF 2 days after removing the DMSO. Geldanamycin-treated cells were stained for SAHF 2, 4 and 6 days after drug removal. Representative fluorescence microscopy images of H69 and H69/41d cell nuclei, six days after removal of geldanamycin, are shown. C. SAHF in H69 (light gray) and H69/41d cells (dark gray) were counted at the indicated times after drug removal. Data are expressed as the percent of nuclei that are SAHF positive. Bars show the mean percentage ± SE. D. Total cell extracts of untreated H69 and H69/41d cells were analyzed for expression of p21 protein by Western blotting.

