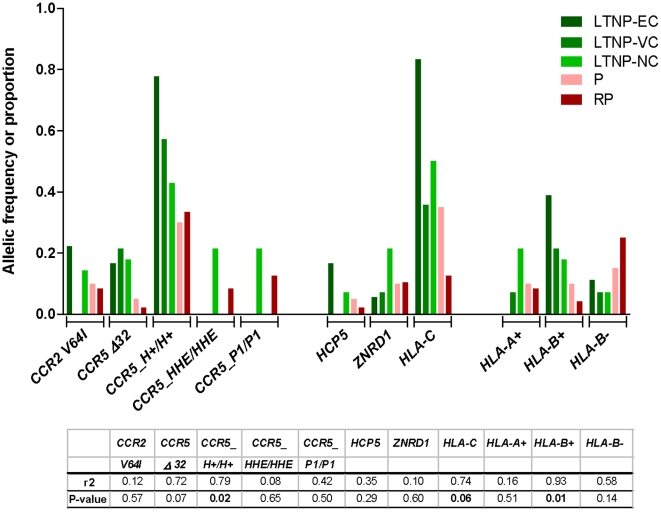
Figure 2. Statistical analyses of the distribution of protective and risk alleles across clinical definitions of disease progression.
Patients who fulfilled criteria for the definition of long term non-progressor elite controllers (LTNP-EC), LTNP viremic controllers (LTNP-VC), LTNP non controllers (LTNP-NC), chronic progressors (P), and rapid progressors (RP). Analysis included genotyping for HLA-C-35 (rs9264942) (HLA-C), CCR5 Δ32 (rs333) and CCR2 V64I (rs1799864), CCR5 haplotypes (inferred from CCR5 Δ32, CCR2 V64I and rs2856758, rs2734648, rs1799987, rs1799988, rs1800023, rs1800024) which define protective (CCR5_H+/H+) or risk haplotypes (CCR5_HHE/HHE or CCR5_P1/P1), ZNRD1 rs9261174, HLA alleles in the HLA-A and HLA−B loci, including protective (HLA−A+, HLA−B+) and risk (HLA−A−, HLA−B−) alleles, as well as HCP5 rs2395029 allele in linkage disequilibrium with HLA−B*5701. The allele frequency of each analyzed marker is presented, with the exception of CCR5 haplotypes, where the proportion of individuals is reported. The specific alleles and haplotypes are shown in Table S1.

