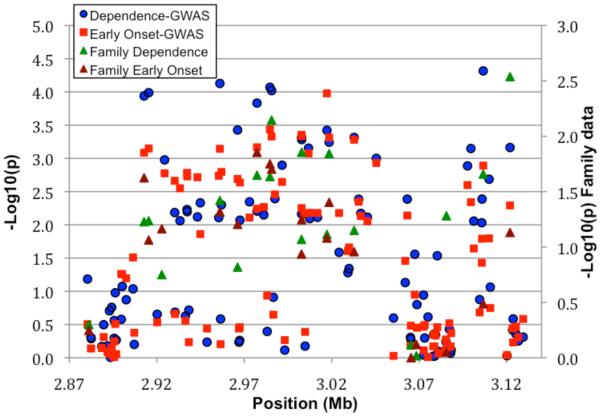
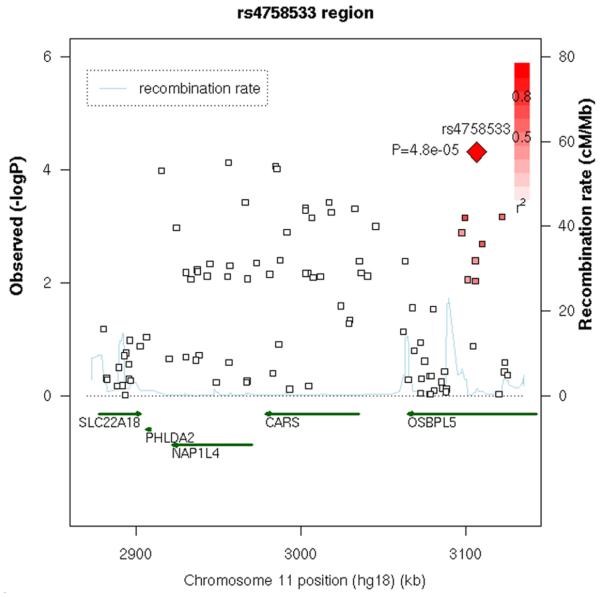
Figure 2. Chromosome 11 region with supporting evidence for association.
A. GWAS data from primary analysis and analysis of early onset, and data from family analysis. All SNPs are plotted as −log10(p-value) vs. position along the chromosome; circles = GWAS alcohol dependence, squares are GWAS early onset; for GWAS data the scale is on the left. Family data are also presented for those SNPs tested; green triangles are alcohol dependence, brown triangles are early onset; for the family data, the scale is on the right. B. LD between the SNP with lowest p value and other SNPs in the region, depicted in a SNAP plot (Johnson et al., 2008). Along the X axis is the physical position in the region (in kb) with known genes shown in their orientation. The left Y-axis denotes the association test result as −log(p-value) corresponding to squares in the figure. The red diamond identifies the primary SNP result labeled with an rs# and p-value. The darkness of the squares indicate the pairwise linkage disequilibrium with the primary SNP; the scale for this is shown in the top right corner. r2 values were obtained from this study using Haploview (Barrett et al. 2005). The right Y-axis indicates the recombination rate, obtained from the available HapMap data in the CEPH Caucasians, and shown within the figure by the solid blue line.


