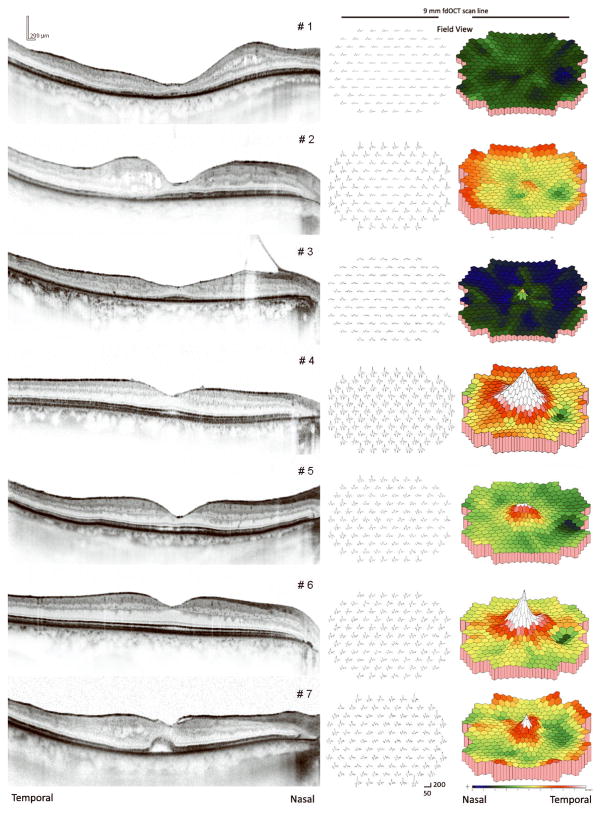
Figure 2.
Horizontal midline fdOCT scans and mfERG results from the right eyes of all seven patients. Left column: fdOCT scans from each patient; Middle column: mfERG responses shown in field view with calibration markers indicating 200 nV/deg2 and 50 msec; Right column: mfERG density plots refined through interpolation with twice the resolution as the 103 stimulus hexagons.

