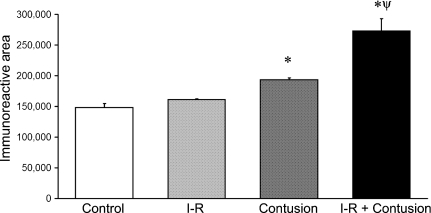
Figure 7.
Quantification of collagen I immunoreactivity in ischaemia–reperfused (I-R) and contused muscle at 21 days postinjury. Representative images are illustrated in Figure 9. * denotes a significant difference from control, P<0.05. ø denotes a significant difference from earlier time point within the same experimental group, P<0.05. ψ denotes a significant difference between contusion and IR-contusion at same time point, P<0.05. Error bars represent the SE of the mean (SEM, n=6 per group).

