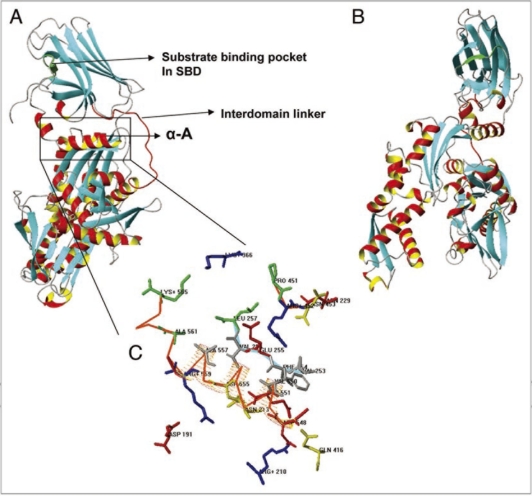
Figure 3.
(A and B) Ribbon representation of PgHsp70 comparative model, Helix A highlighted in a box. The region above Helix A corresponds to the substrate binding domain (SBD) and the region below, to the nucleotide binding domain (NBD). Interdomain linker represented as red Cα trace. (C) Detailed view of interactions between SBD (Cα trace in red orange) and NBD (Cα trace in Cyan) and few discontinuous residues without Cα trace, side chains of residues identical or conserved to the template in blue, red, yellow or dark grey for +, −, polar, or nonpolar. PgHsp70 residues not conserved with respect to the template residues are shown in green.

