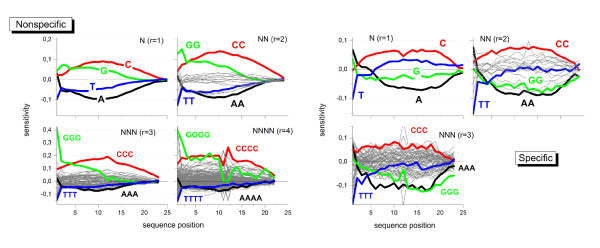
Figure 2.
Positional dependent sensitivity profiles of different rank for non-specific (left) and specific (right) hybridization computed from the Mouse-dataset shown in Fig. 1. Runs of equal bases (e.g. AAA) are emphasized by thick lines in different colors. Note the different ranges of the ordinate scales in both rows of the figure.

