
Figure 6.
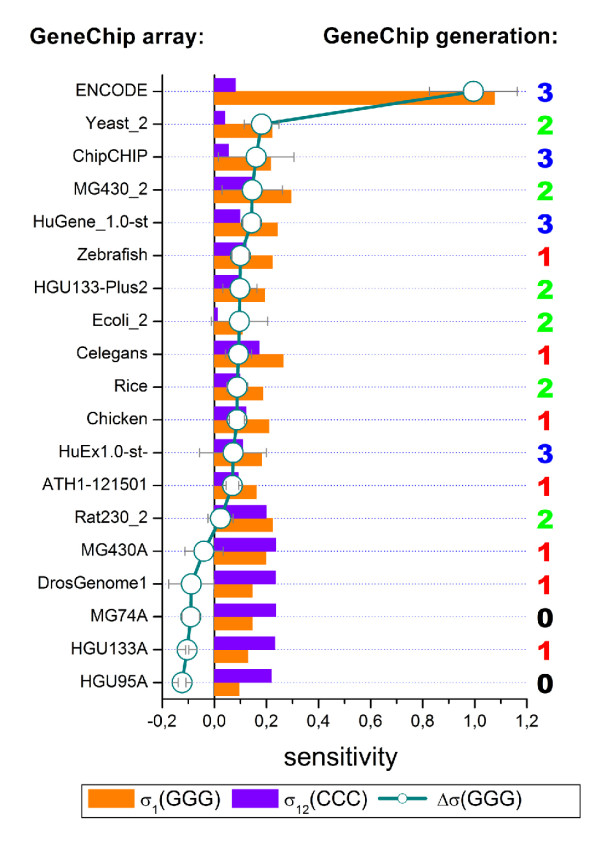
The amplitude of the (GGG)1-effect on GeneChips of different type. The bars refer to the sensitivity terms of triple-G and -C at the first and the middle position of the sequence, respectively. The arrays are ranked with respect to the difference Δσ (GGG) which characterizes the amplitude of the (GGG)1-effect (circles, see text). Sensitivity profiles of three independent hybridizations are averaged for each value. The numbers on the right assign the chip generation 0 to 3 (see text). The amplitude of the (GGG)1-effect tends to increase with the chip generation. The GEO-accession numbers of the samples analyzed are given in the supplementary material (see [Additional file 1]).