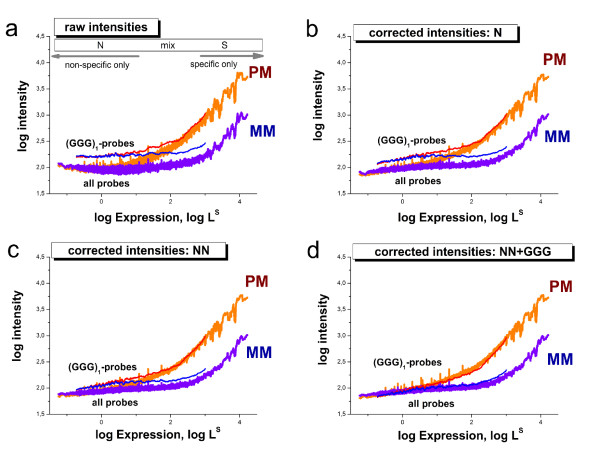
Figure 9.
Correction of microarray intensity data using models of rank r = 1, 2 and the hybrid rank model NN+GGG for the non-specifically hybridized probes of the mouse data set. Specific hybridization is corrected using the NN-model in all cases. The figure shows the averaged intensity as a function of expression as in Fig. 8. The systematic bias of probes containing the (GGG)1-motif progressively decreases with increasing rank of the model and it virtually vanishes for the NN+GGG model. Correction using the NNN model provides a plot which is virtually indistinguishable from that of the NN+GGG model (not shown).

