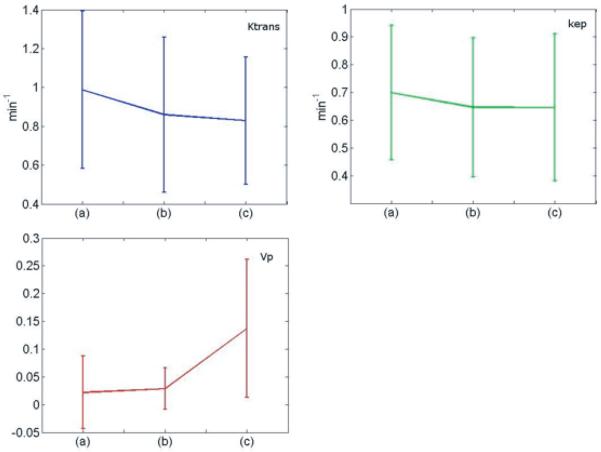
Fig. 11.
Relative mean changes for each of the pharmacokinetic parameters and standard deviation of each measurement. The parameters were measured from 12 patients, with two ROIs selected from each patient. Each chart shows the parameter value when derived from the measured AIF (a), the estimated AIF when arterial voxels are included (b), and the estimated AIF when arterial voxels are excluded (c).

