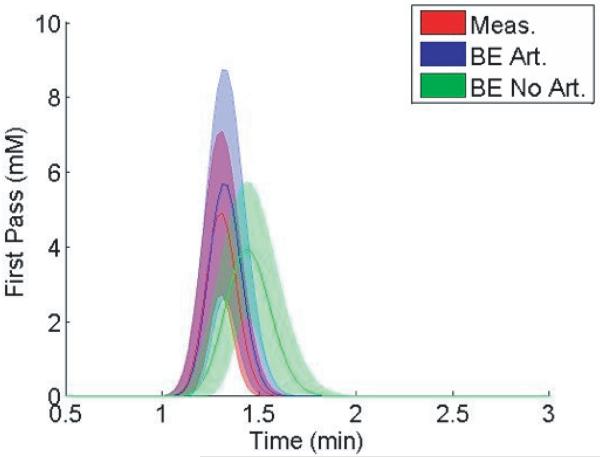
Fig. 12.
Average performance of the AMM algorithm for twelve patients. The curves represent the mean (center) and standard deviation of the first pass bolus of the AIF derived from measured voxels (red), or from the AMM method when arterial voxels are included (blue) and excluded (green). The first gamma-variate curve from the AMM model was used to describe the first pass.

