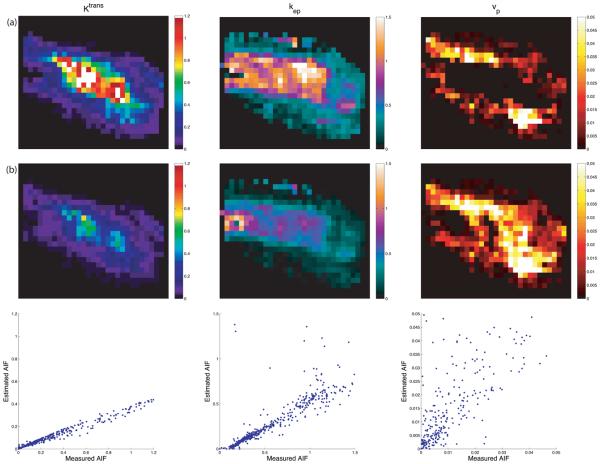
Fig. 8.
Parameter mapping results. The first row (a) used the measured AIF. The second row (b) was derived from the AIF estimated when arterial voxels were excluded. The third row shows scatter plots of the parameters displayed in row (a) (x-axis) and row (b) (y-axis). These maps correspond to the same region as in Fig. 7.

