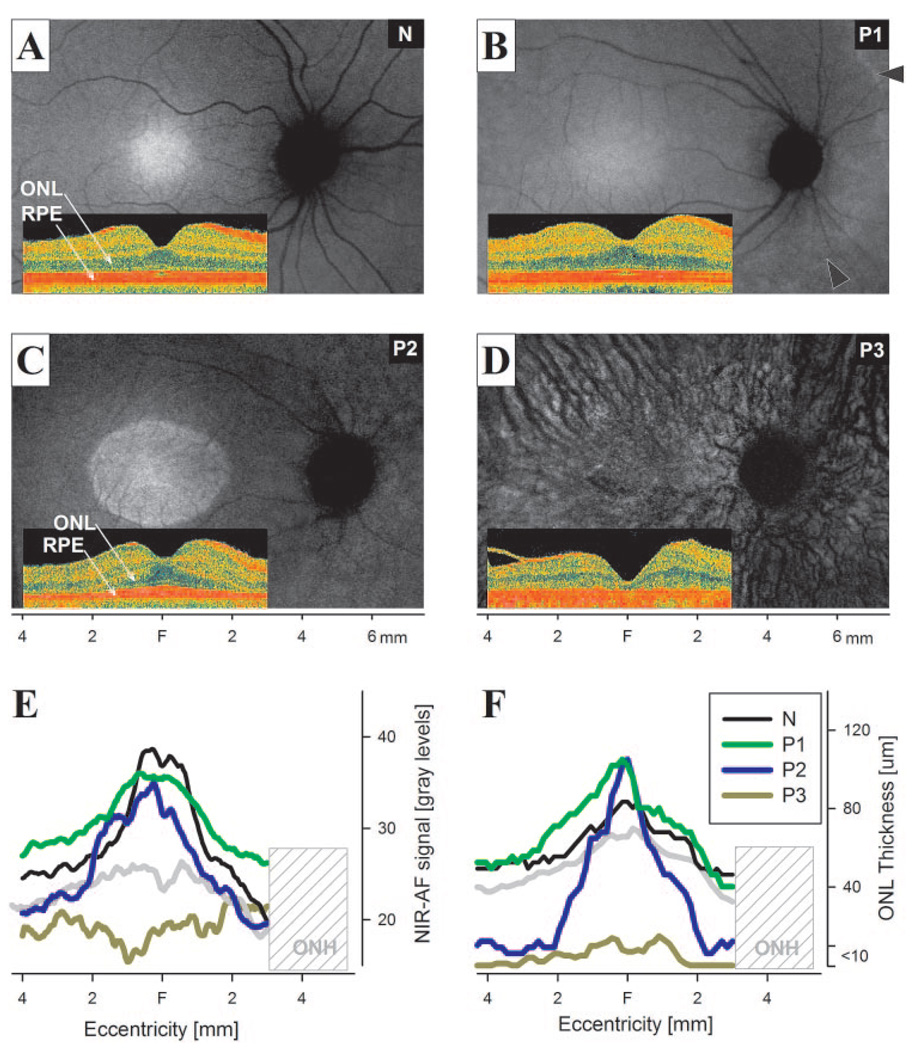
FIGURE 1.
NIR-AF images of normal subjects and USH1B patients. (A–D) NIR-AF images of a representative normal (N, age 24; green iris), and USH1B-affected patients P1 (age 21; green iris), P2 (age 11; light brown iris), and P3 (age 61; hazel iris) at different stages of disease. Images are individually contrast-stretched for visibility of features. Arrowheads: transition zone apparent between the more preserved central retina and the degenerating peripheral retina. Insets: cross-sectional SD-OCT images obtained along the horizontal meridian. NIR-AF signal intensity (E) and ONL thickness (F) measurements along the horizontal profile localized the correspondence between photoreceptor loss and AF abnormalities. The lower limit of normal (mean −2 SD) is shown in each panel (gray trace). Hashed area: the nasal retinal region corresponding to the variable location of the optic nerve head (ONH) in different eyes.

