FIGURE 2.
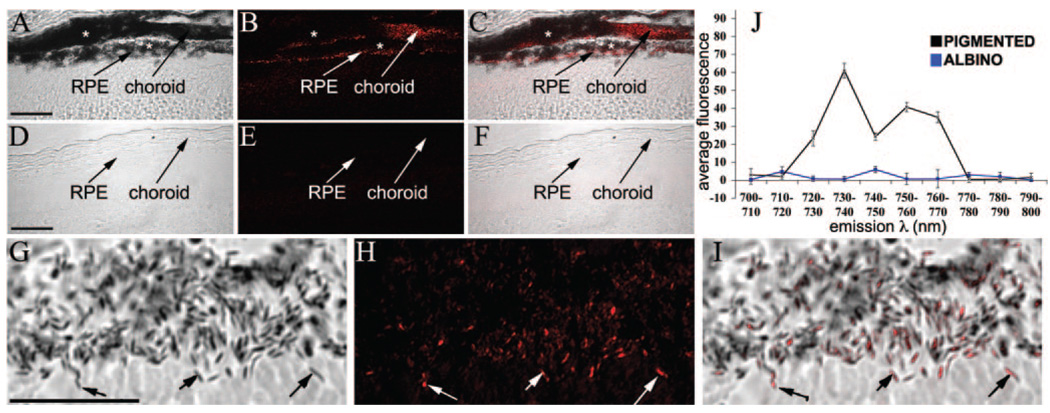
Confocal spectral detection of AF(ex.633) in mouse retina/RPE sections. (A–C) Pigmented and (D–F) albino retinas. Emission wavelengths were 730 to 760 nm. DIC images merged with the peak AF(ex.633) are shown for comparison. (G–I) Higher magnification SDCM micrographs illustrate colocalization of AF(ex.633) with melanosomes. Arrows: colocalization of AF with melanosomes. (⋆) Regions of densely packed melanosomes, yet low AF, which was probably due to the quenching of the emission signal by secondary absorbance. (J) AF(ex.633) fluorescence intensity was plotted against emission wavelength for pigmented (black) and albino (blue) RPE. A major fluorescence peak at 730 to 740 nm and a minor peak at 750 to 760 nm were present in pigmented RPE, but were absent in nonpigmented RPE (n = 3). Scale bars, 25 µm.

